We hope this article will help you realize that product analytics is vital for your business success. We will cover what you should start from, and how to arrange user data in a logical and effective form for analysis. We will also mention the most famous platform and tools for your choice.
Let’s begin!
What is product analytics?
Prior to our decision to purchase a product comes reviewing. We want to know what to expect and make sure we like the quality, accept the price and the features are exactly what we are looking for. Product analysis is meant to provide manufacturers with a clear vision of how to make their creation as good as possible. The analysis makes it obvious whether the product or service is ready to be sold and if to expect delightful results.
The evaluation and comparison may be done by a customer, blogger, or manufacturer itself. Cost, functions, features, performance, sensory analysis, design, efficiency, reliability and durability, safety and risks, terms and conditions, value and reputation, defect rate calculation, etc are examples of the product analysis.
The product should be relevant to what the company claims. It is great if the producer can make small changes to the design and keep the product’s quality the same while reducing their cost. The process is not easy, but it can lead to huge success in logistics, and sales. A nice product analysis opens the way to a patent submission.
Product data
There is no way one can possibly doubt W. Edwards Deming’s concept about being just someone with an opinion if we have no data. Everything in modern technology relies on it and using the product correctly means to be respectful and confident with its data. Product managers perfectly know that being able to see, manage, and get the right wisdom from data is the key to great career progress. Data is a thing created either by labor or thought – from anything you can see in the Christmas window display to a game in your phone, an eBook, a building, or even just a plan or code.
All successful companies are using huge amounts of data creatively and good product data management created the things we all love. Apple gathers its big data through wearable technology. More than 40 million users help to make the most out of this massive data analysis. Netflix boasts 167 million users to collect and personalize the data from. Facebook’s data sources count in more than 1,5 billion, no wonder its advertising platform is the most popular and most paid. Airbnb enjoys experimenting and the company is proud of its own A/B testing plan.
No one expects you to be a crazy data scientist, of course, but having a culture that acts on data is what makes you a cool product manager.
5 tips you need to know before implement product analytics
Now let’s talk about how you can get started with product analytics and what your entry point will be.
Structure your product data
First of all, you need to decide how you are going to structure your product data in order to make it valuable for future interpretation and analysis, as just raw data without context doesn’t mean anything.
Here is an example of how we can structure product data:
Product Hierarchy based
A product hierarchy is a logical and organized structure of your business offer. You must have used it a lot when shopping online (Shoes → Men → Sneakers → Black) and the field of digital products is no exception. Hierarchy is a huge step toward product clarity.
For example, on a video-based platform, it can be: homepage -> video details -> watch the video
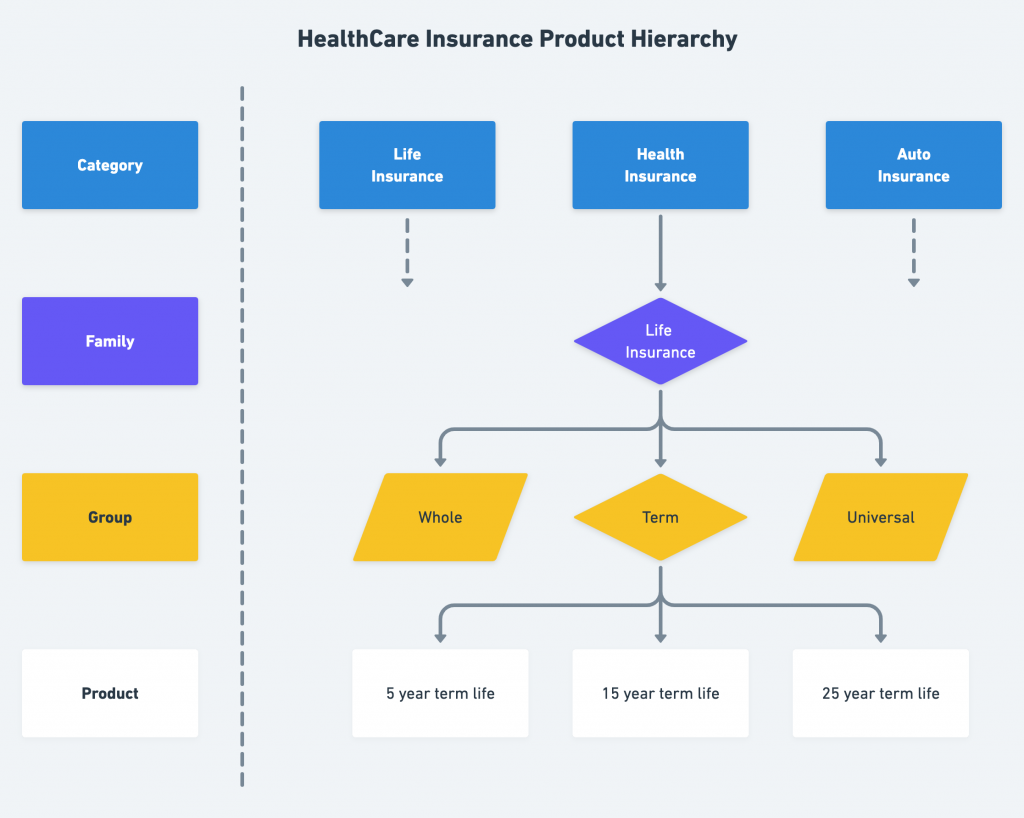
Or a more complex example with a healthcare insurance product:
On the left side of this diagram, you can see a four-tier product hierarchy and, next to it, a relationship in tree views between each product/service.
The earlier you create your product hierarchy, the better your product will grow. As your business changes, the structure will inevitably expand, yet remain a guiding light for you.
Product hierarchy is a great helper to sales managers as it gives vision on the product’s description, features classification, upselling, and benefits measuring. Thanks to this logical structure, releasing messages, notes, and news externally becomes so much easier. It enables better and more intelligent communication between the company’s departments as well as customers’ stronger confidence and the pleasure of using experience.
User Action based
If you expect a user to perform a particular action on your landing page – for example, clicking on a link, pressing a button, scrolling the page, etc. – you can use this approach.
User actions are any move that a user makes when interacting with your product either doing online shopping, exploring a website, creating an account, or playing a game.
Investigating users’ actions and behavior is extremely helpful in understanding trends, patterns, and user engagement in general. User action-based data allows manufacturers to get to know their customers better and figure out what features, updates, and enhancements would the user appreciate the most.
Moreover, you can combine the Product Hierarchy and Action Based approaches when you need to get more detailed information about user behavior on the specific pages/screens with an offer.
Value Action-based
This is a bit more complex than the User Action approach because you need several sequential actions or groups of actions. Examples can be – filling out a form, completing an onboarding process, etc.
In this case, we focus on what users do in their daily activities. Who, what, when, where, how, and why are the questions to answer. In the end, value is what we are looking for. It indicates what is the product worth – essentially, economically and socially, in any dataset.
After you choose one or several approaches for structuring product data, you will have a context and can much more easily process and interpret this data depending on your product goals, and it won’t just seem like chaotic data.
Follow Event and Property concept
It’s a simple concept, but you need to know it because almost all realizations of product analytics are based on that.
Now, when you have knowledge about product data structure and have maybe already chosen one of the above options, you need to think about what actions you expect your users to perform and what data you will send with these actions.
This will be your realization of the Event and Property concept, where Event is triggered by user action and Property is data that you send with the event to store it.
It will help you collect data according to your product data structuring plan. Moreover, in most of the existing cloud-based analytics services, data collection is built on the User and Event properties concept.
Let’s see how it works in practice.
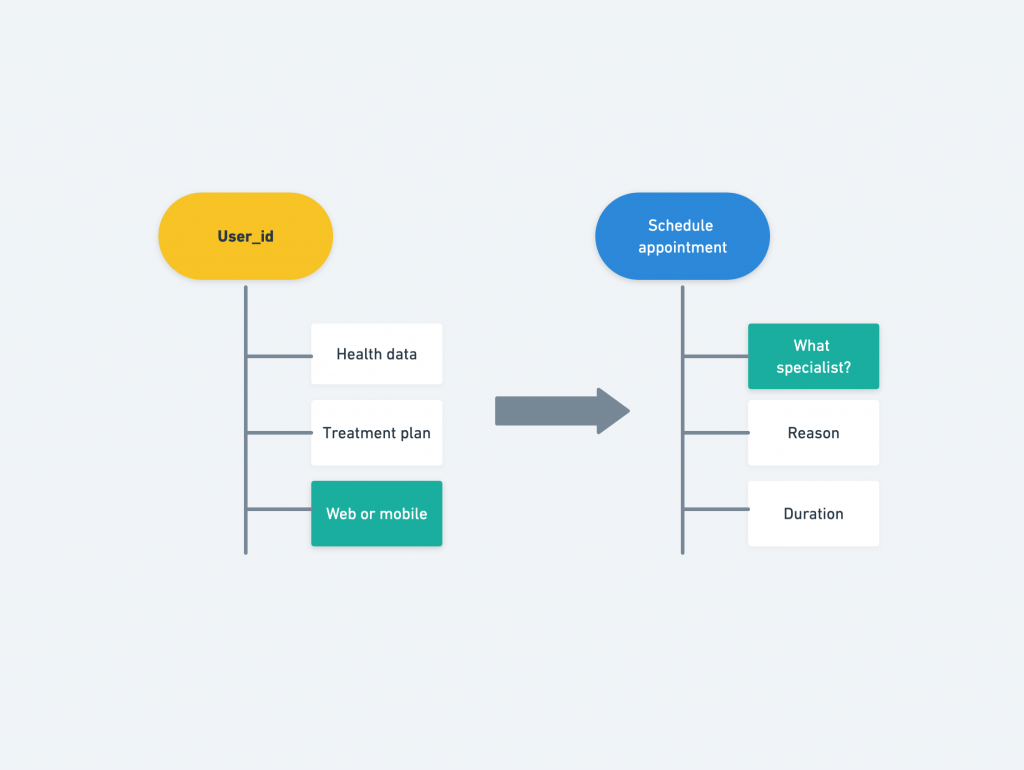
Here is an example. You have got a telemedical product and you need to know how many users schedule appointments with doctors using the app. On the left side, we have the User with the current state and event that was triggered by the user with properties.
The important thing is that the Event properties provide the context of the experience, and you can slice the data by the questions you need to ask. For example, how many mobile users booked an appointment with a therapist? And you can actually do that if you implemented your analytics in this way.
Define where you need an analytics event
This is the next tip that you need to identify really early on.
Every action we do with digital content, whether it is a simple click on a profile or picture download, video pause, or screen loading is interesting. It provides vital information for companies if properly collected and analyzed. They call these interactions Events.
Events can also be passive, non-interaction ones, for example when we scroll down the page. We start scrolling and leave in a moment with our interest lost. There is no meaning in this kind of interaction, as well as in automatically played videos, advertisements that pop up, etc, so it makes sense to treat them like non-interaction events.
- What kind of platforms will your product support?
- Do you have a mobile or web app?
- Do you need to have events on your servers when some data is saved to your database, for example, and so on?
It would be better to answer all these questions before implementing analytics because it is reflected in the structure of events and properties.
Data sharing with third-party tools
The next tip will complement the previous one.
You also need to define third-party tools that your organization uses or will use. They can be:
- CRM Tools (HubSpot, Salesforce)
CRM abbreviation stands for cloud-based customer relationship management.
Both HubSpot and Salesforce offer software applications for making the interactions between companies with their clients better. They aim to improve service, marketing, sales, and communication. The announced price in both cases is quite vague and personalized as you will most likely have to pay extra for such features as additional sales seats, shared inbox communication, etc. Yet, there are cases when team members have the privilege of free seats. It may refer to visibility requirements, making reports, etc.
- BI (Business Analytics) tools (Domo, Tableau)
These are the major tools in the modern market due to their perfect self-service analytics and data image. Professionals love their easy-to-understand dashboard, minimal interface, and reporting tools. Both of them are fine for all types of companies and business users, no matter how rich their technical experience is. Both of them offer three price levels. Domo’s prices are probably too high for a small company. Tableau software happens to be slow to load when processing big amounts of data.
- Custom messaging tools (Intercom, Pardot, etc.)
To integrate them with your product, you will need to send some user statistics as well. It is always good to prepare this data collection before integration. It may also reflect on your events and properties structure
Intercom is perfect for companies that communicate with their clients personally and closely. The messaging tool provides real-time answers, automated messaging is also allowed. Pardot on the other hand is cool when we have different levels of multiple communications and a considerable group of people involved. There is nothing better when planning multiple campaigns within the program than Pardot. With its help, you can collect important data from the emails and find out who, where, and when interacted with them.
Intercom is great in tagging users, splitting chats, and effortless file management, you will never lose any document. Pardot is famous for its automation performance, SalesForce connection, and being user-friendly.
However, some of the complaints are about the absence of built-in calendar functionality in Pardot, as well as little ugliness in the email interface. Intercom users experienced a compound of several messages on top of each other which they find uninspiring and some other minor nuances.
Create a wrapper for data analytics services
Last but not least – use a wrapper for data analytics services.
Nowadays, we have a lot of product analytics services that help you collect all product data. All these providers have their own advantages and disadvantages, but it is a topic for another article.
The main problem of integration with any analytics services is that, once you have integrated them into the product, it can be very difficult to pull them out. They take this advantage once the vendor is locked.
A wrapper will help you solve this problem. So what is a wrapper?
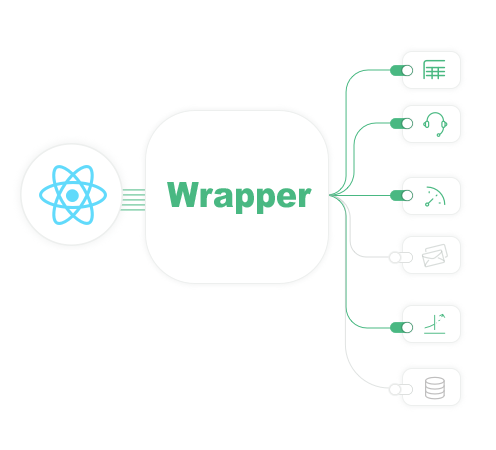
A wrapper is just an additional overlay or abstractions with a single point where you can easily integrate new providers when you decide to for any reason. You can create an implementation for this approach depending on the architecture of your product.
Let’s choose the right product analytics tools
The first question you have to answer is What kind of business are you? Are you Business-to-Business, Business-to-Consumer, or Business-to-Business-to-Consumer?
There are many high-standard product analytics tools and their main features are similar, as a rule. Custom segments and reports you will find almost everywhere, the same goes for automatic data capture and ability to customize the dashboard, you will find extremely effective the option of detailed user segmentation, data funnels for seeing users’ steps like visiting-viewing-purchasing, the ability to attach their properties and priorities, etc. The reason why you need them all is that they make it possible to study your product in three layers – the big picture will proceed to specific flows and end up in each individual user journey.
You should also consider the important way product analytics tools differ from each other. Some of them focus on the quantity of user behavior, while others solve the digital content analytic tasks.
The good news is that the choice of excellent tools and platforms for you to take advantage of is definitely rich.
PayPal, Twitter, Booking.com, Microsoft, for example, decided on Amplitude. This analytic platform is super-advanced for growth teams. Uber and Lemonade preferred Mixapanel, a powerful means for analyzing the patterns in real-time and across different devices. Both of them serve an impressive number of companies worldwide and help to measure what matters the most and leads to fast decisions. They boast cool customer support, cross-platform tracking, high-level behavioral analytics, and Enterprise-level security.
Good old Google Analytics, the foundation of data collection since the very start and is still very important. It paints a vivid picture of where the traffic comes from. However, is it modern enough for your daring business ambitions and growth? Can you rely on it completely?
Heap, Pendo, Do It Yourself, and Localytics are also on the list. If time is crucial for you, Heap is very fast in getting started. It takes only two minutes and you are ready to collect data and make smart decisions. Everything is done retroactively. You do not have to be an engineer to operate events. Pendo answers about users’ beloved vs ignored features as well as pleasant to use vs confusing. No need to write any additional codes, you can set up improvements and guides for the users to get the most of their experience quite easily. Isn’t it wonderful? Localytics tracks new users and user acquisition campaigns across different devices. Marketers love its prediction creation function, super-advanced reporting features, and fast installation.
Of course, you can create your own gadget for product analytics in private for extra costs but be aware of possible risks.
Data-directed companies inevitably get more customers and manage to keep them for a long long time. They end up being profitable and growing thanks to wise and confident management. To make your business rely on data you should find the product analytics tools that are best for you and our research was meant to make you more self-assured in this choice.
Thank you for reading this article till the end. These were 5 tips you need to know before implementing product analytics. Use them confidently and enjoy your effective business journey, as you are safer now from most of the common risks. You will see how much you benefit from product analytics, get a better vision and perspectives, and be proud of your product’s impressive growth!
- FAQ
Product analysis is meant to provide manufacturers with a clear vision of how to make their creations as good as possible. The analysis makes it obvious whether the product or service is ready to be sold and if to expect delightful results.
CRM Tools (HubSpot, Salesforce)
BI (Business Analytics) tools (Domo, Tableau)
Custom messaging tools (Intercom, Pardot, etc.)